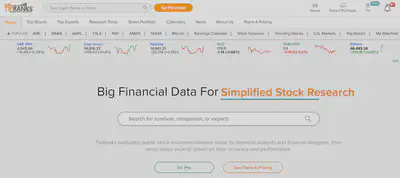
TipRanks Introduction, A Stock Research App Powered With AI and Analyst Ratings Insights

Table of Contents
Pros of TipRanks
Analyst Ratings, TipRanks’ Most Valuable Tools
TipRanks is an investment analysis platform for US stocks with rich tools inside. It helps investors know better about their investment targets. Of all the tools, the most valuable one is the Analyst Ratings. The analysts on the platform are all coming from the top financial experts in the industry like J P Morgan, Bank of Americas, etc. Those analysts, with their professional financial knowledge, visit companies in person, have interviews or conference calls with companies’ top executives, chief accounting officers, chief financial officers, do research and make their investment reports and comments, summarize a buy, sell, or hold recommendations and a target price. Most importantly, through interviews with insiders, these analysts can know rumors ahead of the retail investors if the company will have a record high sales or profits next quarter, if the company will raise the price of their products, the change in profit margins, or if the company will get big orders from its customers. These are all leading indicators of the stock market, and a kind of insider news to obtain abnormal returns.
Powerful Data-driven Analysis with Cutting-edge AI Technology
Not only do TipRanks have the qualitative analysis from the analysts, but they also feature data science to do AI analysis. Simply put, TipRanks offer you all the information you need to find the analyst you trust. It uses machine learning and natural language processing to measure the performance of these analysts. Thus, investors can make solid-informed investment decisions. TipRanks let you know the historical performance of every analyst, blogger, hedge fund manager, or insider.
Not only do TipRanks apply AI analysis to the data of analysts, but it also applies AI analysis to other functions. For instance, TipRanks can parse the news related to Tesla, distinguish whether the news is bullish or bearish, extract the keywords in the news, and even come up with a sentiment indicator.
Cons of TipRanks
Lack of Fundamental Data from Financial Statements
With respect to financial statement analysis, TipRanks only have data like market cap, EPS, dividends, sales, profits, ROE, etc. Although investors can understand a company’s profitability and dividends records from these important fundamental data, it requires more to fully understand a company. For instance, if an investor wants to understand a company’s solvency, he or she has to know the company’s debt ratio, current ratio, quick ratio, and interest coverage ratio. If an investor wants to know a company’s profitability by Dupont analysis, it’s not enough with only ROE data from TipRanks. It also requires profit margins, asset turnover, and equity multiplier.
There is no Chinese version.
TipRanks is a platform focused on US stock investing. These years it’s been more and more popular for Chinese and Taiwanese to invest in US stocks by opening a foreign account. Currently, TipRanks has only English version, but some people are not good with English. If Chinese is supported on TipRanks, a huge number of Chinese customers can be added to the platform.
Introduction of the functions on TipRanks
Analyst Forecasts
Analyst Forecasts is the most valuable function on the app. Using Apple as an example, see the figure below, it has a Strong Buy recommendation as a whole from 28 analysts, of which 23 analysts rated Buy, 5 analysts rated Hold, and 0 Sell.
On the right-hand side, analysts come up with a target price of 193.36 for the following year, which has an upside potential of 10.93% from Apple’s current price of 174.31. The target price of 193.36 is the average from 28 analysts in the past 3 months, where the highest target price issued by analysts is 215, and the lowest is 161.
For paid users, they can check the stock ratings and target prices from only the top analysts. Top Analysts are people who have the ability to consistently beat the market.

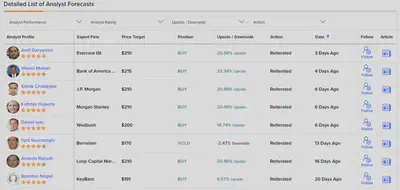
Scroll down, as the figure seen below, TipRanks offer Apple company’s detailed ratings of each analyst, including the name and the ratings of the analyst, the company the analyst works for, target price, buy or sell ratings, stock price potentials, ratings up or down, how many days ago the rating is issued, and the news related to the rating. Users can also follow the analysts they trust.
From the second row of the below figure, Wamsi Mohan, an analyst from the Bank of America Securities, issued a target price of 215 to Apple 4 days ago, maintaining its buy ratings with a potential price upside of 23%. In his ratings report, it is mentioned that Apple decreased its trade-in price, which may boost the demand for its new product iPhone SE.
In the function of Analyst Forecasts, only paid users can view the newest 10 ratings report of a specific company, and filter or sort the ratings table. Paid users can filter reports issued by analysts of 4 stars or above, or filter only upgrade reports.
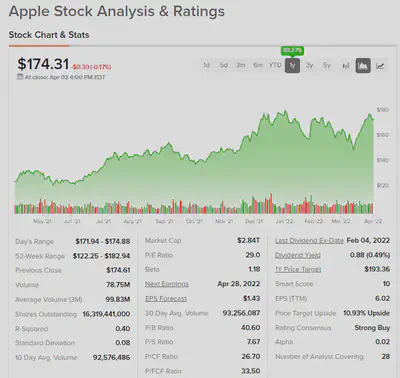
Stock Analysis
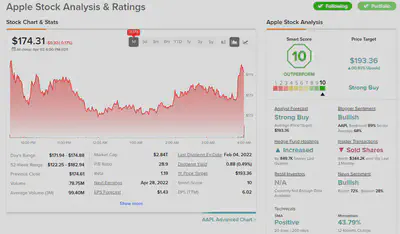
The Stock Analysis function is the company’s overview and introduction. There are basic or advanced stock price charts, Smart Score (We will introduce this in detail later.), basic key financial numbers (market cap, PE ratio, dividend yield, etc), related news, etc. One special feature is that TipRanks offers the company’s QA below. For instance, which hedge fund is the major shareholder of Apple? The answer is that in many funds that hold Apple, Buffet’s Berkshire is the largest Apple holder. The value of Apple stock Berkshire holds is as high as 158 billion.
Smart Portfolio
TipRanks’ Smart Portfolio is basically a watchlist, but with many AI functions. Users can add stocks of their interest to their watchlist. A very convenient thing is that users can see the related news of their portfolio.
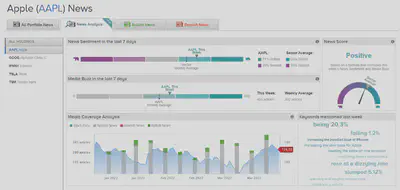
The unique thing about TipRanks in the news analysis is that news can be classified as bullish news or bearish news, and the news sentiment is generated from AI algorithms. As the figure is shown below, Apple’s news sentiment is bullish, comprising 71% bullish sentiment and 29% bearish sentiment. On the other hand, paid users can view the news score in the upper right corner that Apple is in a bullish market state.
The bar chart below represents the weekly frequency of bullish or bearish news over the past 3 months.
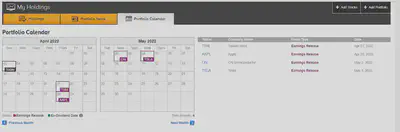
Another useful feature is the portfolio calendar, which enables investors to know when there is an earnings release on the stocks of their watchlist. Usually, these kinds of events will have a significant impact on the stock price. Investors should keep a close eye on it.
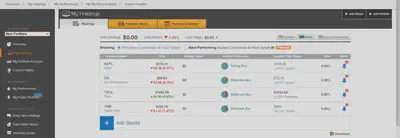
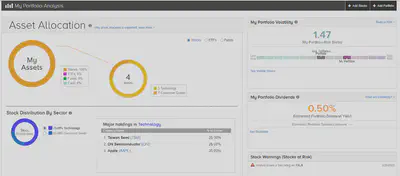
Another valuable feature is portfolio analysis. As the figure is shown below, I have 3 stocks in the technology sector and one stock in the consumer goods sector. I don’t see it reasonable to put my Tesla in the consumer goods sector. Instead, I think Tesla should be in the technology sector. On the upper-right corner, my portfolio has a beta of 1.47. Beta is a measure of volatility. It means that if the market is up or down 1%, on average your portfolio will go up or down 1.47%. We can also see in the middle right that I have an overall dividend yield of 0.5% in my portfolio.
And my portfolio has a PE ratio of 75 as shown in the lower-right corner, which is quite high I think.
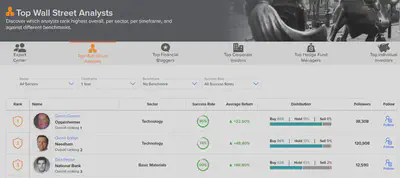
Top Wall Street Analysts (Paid Members only)
Top Wall Street Analysts is one of the most valuable features for paid users of TipRanks. It lists the top-rated analysts based on analysts’ success rate, average returns, and the number of followers. Paid users can also filter the list. For instance, users want to know the best analysts in the financial sector who have a success rate between 75% to 89%. With this filter, Bill Carcache is shown to be the best analyst.
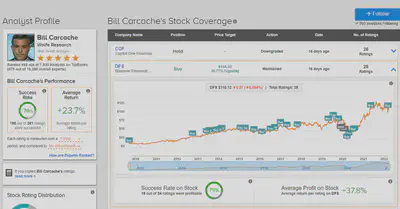
As the figure is shown below, Bill is ranked 59 out of 7930 analysts. He has a 5-star rating with an average success rate of 76% and an average returns of 23%. The stocks he covered include Discover Financial Services (DFS) etc. In the numerous ratings Bill issued to DFS, we can see the trends of stock price and issued ratings in the graph. This analyst has recommended a buy rating to DFS since 2010. In his 28 ratings of DFS in the past 12 years, there are only buy or hold ratings, none of which is a sell rating. He keeps a positive attitude toward this company. The stock price has gone from 13 to 110 now. The returns are spectacular.
Top Financial Bloggers (Paid Members only)
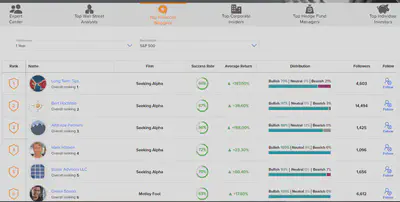
TipRanks is one of the few websites that rates bloggers (financial experts). There are 3 major standards to rate these experts, one of which is the success rate of the financial bloggers, representing whether there is a profit or loss one year after a blogger recommends a target. The second standard is the average returns one year after the recommendations. The third standard is statistical significance. Basically, the higher the number of recommendations blogger issues, the higher their measures of performance is statistically significant and reliable.
The figure below shows the best bloggers based on the one-year period measurement and benchmark of the S&P index. The one ranked first out of 8350 bloggers is the Long Term Tips from Seeking Alpha, with a success rate of 66% and average returns of 197%. The most recent buy recommendation they made is Microsoft, recommended as of December 2021. In their recommendation article, it is mentioned that Microsoft offers various products among 3 business categories, many of which have substantially solid moats, and stands as a leading competitor in the industry.
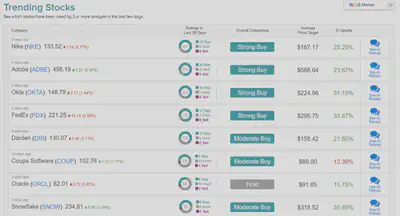
Trending Stocks
This feature summarizes popular stocks where there are more than 3 analysts issue a rating in the past 30 days, which allows you to feel the short-term trends, find new valuable companies and diversify your portfolios. The figure below shows that the most trending stocks recommended in the past 30 days are Nike, Adobe, and Okta, having 24, 24, and 22 ratings issued by analysts respectively. All the 3 stocks have overall ratings of strong buy with a potential upside returns of 23~51% implied by the average targe price.
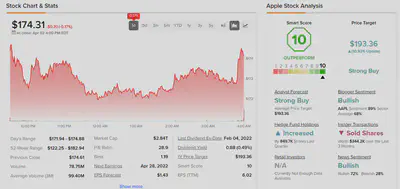
Smart Score
TipRanks’ Smart Score summarizes a company’s overall ratings from a range of 1 to 10. It’s a fully-automatic data-based rating system without human interaction. The data is based on 8 unique indicators, including analyst recommendations, crowd wisdom, hedge fund activities, news sentiment, and multiple technical indicators.
The figure below shows that Apple got a full rating of 10 on Smart Score, but insiders are selling stocks in the past 3 months. This is worth taking a deeper look at it. The reason may be a too-high stock price or insiders need cash.
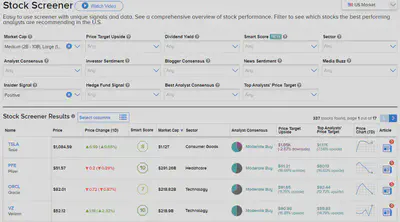
Stock Screener
Stock Screener is a very very useful tool. Users can filter from market cap, stock returns potential, dividend yield, stock smart score, industries, analyst ratings (buy or sell), investors sentiment, blogger ratings, news sentiment, or best analyst ratings, etc.
And exclusive filters for paid users are as follows: sock smart score, insider signals, hedge fund signals, best analyst ratings, best analysts target price.
This time we filter companies with medium or larger market caps (over 2 billions) and positive insider signals. Insides are companies’ top executives, board members or supervisors, and shareholders with a stake of more than 10%. When insiders buy or sell stocks of their own company, they have to report to the SEC within 2 working days. Investors can watch the insider transactions to see if they are more confident about their own companies. With these two criteria, we have the EV company Tesla, Covid vaccine company Pfizer, and database company Oracle.
Hedge Fund Activity
This feature tracks the activity of hedge funds. It’s helpful to understand the price movements from the activities of big investors. The figure below shows that hedge funds acquire 850 thousand shares of Apple in the last season.
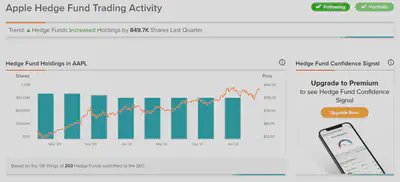
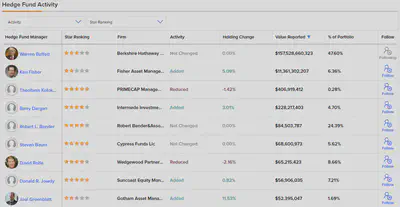
On the other hand, the figure below shows the holdings of Apple for each fund. Order by values of Apple holdings, the fund that holds the most value of Apple stocks is Berkshire. The value is as high as 157 billions. That is a huge bet.
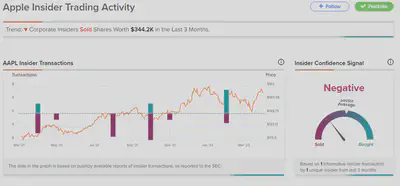
Insider Trading Activity
This feature tracks the activity of insiders, representing the transactions of the company’s top executives, board members, supervisors, or shareholders with more than 10% stake in the stocks of their own company. As the figure is shown below, insiders have sold Apple stocks worth 340 thousand in the past 3 months. On the right-hand side, we can see that the confidence level of insiders is negative (membership-only feature). However, the value is relatively small and it’s a short-term phenomenon. I think investors still have a bullish view on Apple’s future.
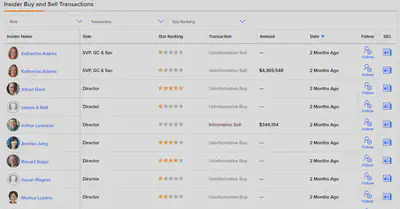
The table below shows the data of each insider transaction, including the name of the insider, their position in the company, transaction value, and related SEC filings. Only paid users can see the latest 5 insider transactions.
Sunfortzone
Welcome to Sunfortzone, our goal is to help value investors understand more about their investments.