Interactive Brokers Peers Comparisons by Sales and its Operational Overview
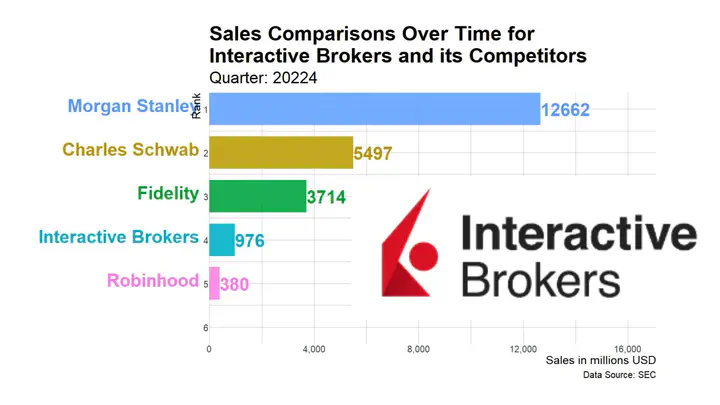
Table of Contents
Interactive Brokers Peers Comparisons by Sales and its Operational Overview
Interactive Brokers Peers Comparisons by Sales
Interactive Brokers is a well-known online discount brokerage firm that offers a wide range of trading services for stocks, options, futures, forex, bonds, and more. In the United States, there are several competitors to Interactive Brokers that offer similar trading services. The video shows the quarterly sales comparison for Interactive Brokers ad its brokerage peers, including Morgan Stanley, Fidelity, Charles Schwab, Robinhood, and AMTD IDEA Group. The reason why we take Morgan Stanley into the brokerage industry comparisons is because Morgan Stanley acquire a trading services company called E-trade in 2020. And about AMTD IDEA Group which headquartered in Hong Kong, they have a well-known trading services brand called TD Ameritrade.
Welcome to Sunfortzone, our goal is to help value investors understand more about their investments and become a better person.
If you want to grow on the path of value investing, please subscribe to our Youtube channel to get more valuable contents in the future.
Wall streets make money on activities, we, as value investors, make money on inactivities.
Here we would like to recommend a great book called The Intelligent Investor by Benjamin Graham. The book is suggested by value investor Warren Buffet. As Warren Buffet said, Chapters 8 and 20 in this book have been the bedrock of my investing activities for more than 60 years. I suggest that all investors read those chapters and reread them every time the market has been especially strong or weak. The link of the ebook is here, you can read it a little bit for free in the Kindle.
Interactive Brokers’ operational overviews
The following comes from Interactive Brokers’ 2022 fourth quarter conference call.
The good news about 2022 can be seen in Interactive Brokers’ numbers. Interactive Brokers now have over 2 million customers around the world. They earned $3 billion in net revenues annually for the first time. In the fourth quarter, their pretax margin reached 71%, by far the highest in the industry.
After 2 years of unprecedented investor interest in the markets overall, we now see some retrenchment and more localized engagement in particular product segments like futures and options rather than across the board. Rising inflation and interest rates as well as geopolitical uncertainty in places around the globe, helped commodity, interest rate and stock index futures become more popular, while options were increasingly used to manage risk. Equity markets grew weaker as inflation and the impact of central bank policies took hold.
After years of persistent deficit spending with 0 and negative interest rate policies around the world, we believe inflation is going to stay with us. It is likely to stay above 4% and the Federal Reserve will keep rates at this level or higher and eventually we’ll have to give up on getting inflation down to the current 2% target. We believe that the inflation target will be raised.
Interactive Brokers continues to grow in terms of the number of customers.
Higher inflation and lower equities markets impacted IB’s industry. For IB, their year-on-year account growth was 25% in 2022. While for many companies, this would be good news, we want to do better. Interactive Brokers’ natural account growth by word of mouth is 10% to 20%. When markets go down, as they are now, that growth is closer to 10%. And when the market goes up, that growth is more like 20%.
Interactive Brokers’ sales efforts also add another 10% to 20% on top of that. Though in the short term, that growth can be very lumpy.
Interactive Brokers still see the bulk of the onboarding of the 2 new introducing broker clients they have mentioned happening in the second and third quarters of 2023.
Interactive Brokers has the advanage to offer their customers the best available price with their leading-edge systems.
There’s a lot of discussion on the conferenc call around market structure, an Interactive Brokers auction model for options offers customers a path to best execution. In a volatile market, options have continued to be a security of choice for investors, both to take on exposure to a security at a lower cost than buying the stock outright and as a way to mitigate risk. Industry listed U.S. options average daily volume was over 41 million contracts in 2022, up from under 40 million the prior year.
Interactive Brokers do not accept payment for order flow for IBKR Pro customer orders. Rather, they invite pegged to the mid-price orders by institutions and market makers to our ATS to trade with our retail orders. Somewhat similarly, we auction off each option order among 22 top market makers and other professional traders who give their best bids and offers for every order our customers enter.
These auctions last something on the order of 100 milliseconds, and the winner chooses which exchange wants to use to trade with the order. Interactive Brokers then post the order for a second auction at the exchange. And if nobody improves on the price, the original winner of the auction trades the contract at the previously agreed-upon price. This all happens in a fraction of a second. All participants use automated processes and they automatically feed the amount of price improvement they are interested in competing on for any specific option contract at that specific time to trade with. This competition to win the auction means Interactive Brokers’ customers can take advantage of a leading-edge system designed to get them the best available price.
Interactive Brokers are now going to enhance this system by enabling their own customers who are so inclined to participate in this process on the market maker side. Interactive Brokers are going to give them an order type with which they can signify the option or options they want to buy or sell. And then when Interactive Brokers receive an opposing order, we will bid or offer on their behalf, along with the market makers. They will also tell us the price relative to the floating mid-price, the middle of the bid offer spread that they are willing to pay up to and our software will do the bidding for them. Interactive Brokers still have some minor details we must work out with this project, but they are hoping to be able to introduce this capability to their customers by the end of January 2023.
Interactive Brokers is at the cutting edge of this best execution through auction process. Interactive Brokers was the largest market makers and auctions for over 30 years, so Interactive Brokers is very well versed in these processes, and they have been keeping them up to date over the years. With the potential for a new regulatory process, in addition to new exchanges and continuously evolving new rules, they have a team of programmers regularly engaged in this activity.
If some similar method becomes required, sophisticated mechanisms like the ones Interactive Brokers use could take a long time and great expense for others to create. There’s a lot of debate on this, but Interactive Brokers will be good with whatever ends up being the outcome. By the way, Interactive Brokers is always happy to welcome more market makers to our platform. Interactive Brokers added another 4 this past year.
Interactive Brokers introduced more new products and expanded the capabilities of existing ones. Recognizing their global customers’ reach, Interactive Brokers introduced global trader, a streamlined version of our platform for mobile devices which allows our clients to trade in over 90 stock markets worldwide. Interactive Brokers continue to enhance their options trading tools from mobile options trading to our rollover options tool, strategy builder and probability lab. Interactive Brokers will be upgrading their platform with more features and capabilities. They are introducing new tools for financial advisers, ones they have been asking for and that will set our offering apart as best in its class as well as being among the lowest cost for an adviser to use. Interactive Brokers are also adding new countries where our clients can trade.
Interactive Brokers’ new operations in Hungary
Interactive Brokers were pleased to receive our bank license in Hungary and plan to make it operational in 2023. Unlike in the U.S., customer funds on deposit with an EU broker may not be used to finance margin borrowings by other customers of the broker. Only banks can lend their customers’ funds to other customers no matter what kind of collateral is involved. Our primary purpose with this EU bank is to facilitate such financing.
There is much to look forward to. The Interactive Brokers platform is built with the purpose of bringing investors and marketplaces together all over the world, optimizing the allocation of capital and resources. It is their job to develop the best tools and capabilities to facilitate that. Interactive Brokers is as busy programming as they’ve ever been. This and our much lower cost structure is what sets us apart and will continue to do so in the years ahead.
2022 fourth quarter financial results
Next we’ll review Interactive Brokers’ fourth quarter results on 2022. Starting with their revenue items. It’s a pleasure with the record financial results they achieved this quarter. Commissions rose versus last year despite declining global market indices, reaching $331 million, their third highest quarter ever. For the full year, commissions were $1.3 billion, down only slightly from 2021 meme stock spike in trading. We saw higher trading volumes in futures and options in 2022, coming from Interactive Brokers’ large base of sophisticated and active traders, investors and advisers.
Net interest income of $565 million for the quarter and $1.7 billion for year 2022, reflected increases in benchmark rates worldwide. U.S. rates have moved from an average effective rate of 0.08% in the fourth quarter of 2021 to 3.65% in the fourth quarter of 2022. This led to higher interest earned on margin loans and their segregated cash portfolio. These were partially offset by the higher interest paid to our customers on their cash balances as interactive brokers passes through to them all rate hikes above the first 50 basis points on their qualified funds.
Other fees and services generated $43 million for the quarter and $184 million for the year 2022. The drop from the prior year quarter is driven primarily by the risk off positioning of customers, which led to a reduction in risk exposure fees from $18 million to $6 million. FDIC sweeps fees rose to $3 million this quarter, while market data fees of $18 million and exchange liquidity payments of $9 million were both off 10%.
Other income includes gains and losses on their investments, their currency diversification strategy and principal transactions. Note that many of these noncore items are excluded in their adjusted earnings. Without these excluded items, other income was $19 million for the quarter and $39 million for the year.
Turning to expenses. Execution, clearing and distribution costs were $90 million in the quarter and $324 million for the year. The increases were led by lower liquidity rebates and nonrecurrence of 2021’s options fee reduction and few holidays from unusually high volumes throughout the industry, high futures volumes, which carry higher fees and an increase in the SEC fee rate on U.S. stocks and options.
Compensation and benefits expense was $119 million for the quarter for a ratio of comp expense to adjusted net revenues of 12%. For the year, this ratio was 14%, unchanged from last year despite a 10% increase in headcount. Interactive Brokers continue to focus on expense discipline while improving their strong top line. Their head count at year-end was 2,820.
Interactive Brokers’ pretax margin was a record 71%. Automation and expense control along with prudent management of our balance sheet, remain our key means of maintaining high margins while we continue to hire talented people and invest in the future of our business.
Interactive Brokers’ total assets ended the year at $115 billion, with growth driven by higher customer cash balances, partially offset by lower customer margin lending.
Account growth remains robust with 415,000 net new account adds for the year. Total accounts broke through the $2 million mark in 2022, closing the year at $2.1 million, up 25% over the prior year.
Total customer daily average revenue trades were 1.9 million trades per day, reflecting a risk off period for investors and down from last year’s stronger market environment. Commission for a cleared commissionable order of $3.15 was up 32% from last year as our clients’ volume mix included fewer low-priced stock trades and larger average trade size and options.
Total GAAP net interest income was $565 million for the quarter, up 92%, and $1.7 billion for the year, up 45%. These reflected strength in margin loan and segregated cash interest, partially offset by higher interest expense and customer cash balances.
The Federal Reserve raised interest rates twice in the quarter by 75 basis points in November and a further 50 basis points in mid-December. These increases had a partial positive impact in a 12-week quarter but will have a full impact in the first quarter of 2023. Other central banks also raised rates this quarter, including the U.K., Hong Kong, Canada, Australia, the Eurozone and Switzerland. Higher interest rates led to margin loan interest income up 32% over the third quarter and 182% over the prior year quarter, more than compensating for lower average balances in both periods.
Securities lending net interest was not as strong as in the prior year for a few reasons. First, while overall customer demand for shorting stocks and borrowing shares rose, there were fewer hard-to-borrow names throughout the industry. Second, benchmark rates are rising.
The interest we earn on cash collateral received in exchange for lending stock is also rising. We estimate that the incremental interest earned on this stock loan cash collateral from rate increases was $42 million for the first quarter of 2023.
Interest on customer credit balances or the interest we pay to Interactive Brokers’ customers increased, higher rates than nearly all currencies led to Interactive Brokers paying interest on qualifying balances as they pass through these rate increases to customers. Interactive Brokers paid $487 million to customers on these balances in the fourth quarter and a total of $763 million for 2022. Fully rate-sensitive balances were about $20 billion this quarter.
Now for the estimates of the impact of increases in rates, given market expectations of more rate hikes to come, it is estimated that the effects of increases in the Fed funds rate to produce additional annual net interest income is as follows: at 25 basis points, an increase of $49 million; at 50 basis points, an increase of $97 million; at 75 basis points, an increase of $146 million; and at 100 basis points, an increase of $195 million. Note that the starting point for these estimates is December 31, with the Fed funds effective rate at 4.33% and the balances at that date.
In conclusion, Interactive Brokers had a financially strong quarter, closed out a record year of net revenues and pretax margin, reflecting the continued ability to grow customer base and deliver on core value proposition to customers. They’ve done this while highlighting the attractiveness of its strategy to automate for growth, expanding what they offer while minimizing what they charge. They do this at a low cost managing the growing business effectively and with strong expense control.
Thanks for spending your valuable time with us! If you like our contents, please subscribe to our Youtube channel to get more valuable contents in the future.
On the other hand, please visit our website Sunfortzone.com to get more data-driven fundamental analysis, and join our Discord Server to grow with other value invesors!
What’s your idea about this? Please leave a comment below. We would glad to learn something from you as well!
Related Articles
EV Makers Net Income Comparisons | Tesla’s Visions and Goals
Net Income Comparisons Over Time for Amazon, Alphabet(Google), and Microsoft from 2000 Q1 to 2022 Q4
Sunfortzone
Welcome to Sunfortzone, our goal is to help value investors understand more about their investments.